Receptive field mapping · module 01
Click anywhere on the 80°-wide tangent screen to place the cell’s receptive-field center. Its diameter grows with eccentricity using macaque V1 scaling; map the signed field with sparse dots or a contrast-modulated noise movie.
The display spans 80 degrees of visual angle horizontally, from minus 40 to plus 40 degrees, and 42 degrees vertically. Choose balanced bright and dark dots or a contrast-modulated Gaussian noise movie. Click to move the receptive-field center; arrow keys move it by half a degree and Shift plus an arrow moves it by one tenth of a degree. A central cross is the fixation target and a turquoise circle marks the selected receptive field.
Live reverse correlation
The estimator looks backward from every spike by 60 ms. Bright- and dark-triggered response rates are subtracted to reveal signed ON and OFF subregions.
Gray shows sampled locations; red marks the strongest positive sample 60 ms before each spike.
Fixed 8° × 8° RF-centered window; the spatial scale does not change. Blue OFF, red ON, gray zero.
The fitted Gabor appears after four passes; the dashed ellipse is the fitted Gaussian envelope.
How to read the experiment
The RF’s selected center determines its eccentricity and therefore its V1-scaled diameter. The signed structure is then estimated with the same first-order reverse correlation.
Clicking sets its center in visual degrees. The simulator applies the V1 diameter/eccentricity ratio of 0.21 from Freeman and Simoncelli’s physiological meta-analysis, with a small foveal floor.
For every spike, the estimator retrieves the complete earlier stimulus frame. Sparse dots use bright-minus-dark rates; the pink-noise movie uses a Fourier-whitened spike-triggered average.
A least-squares Gabor fit estimates center, orientation, spatial frequency, phase, and envelope from panel 02’s measured signed RF. Panel 03 enlarges that fitted surface.
Primary literature
The estimator follows references 2, 3, and 8 of the supplied review: randomized bright/dark sparse noise, spike-triggered temporal alignment, and a signed first-order RF.
Supplied review · method synthesis
DeAngelis, G. C., Ohzawa, I. & Freeman, R. D. (1995). Receptive-field dynamics in the central visual pathways. Trends in Neurosciences, 18, 451–458.
doi:10.1016/0166-2236(95)94496-R ↗Review ref. 2 · 2D reverse correlation
Jones, J. P. & Palmer, L. A. (1987). The two-dimensional spatial structure of simple receptive fields in cat striate cortex. Journal of Neurophysiology, 58, 1187–1211.
doi:10.1152/jn.1987.58.6.1187 ↗Review ref. 3 · x-y-t reverse correlation
DeAngelis, G. C., Ohzawa, I. & Freeman, R. D. (1993). Spatiotemporal organization of simple-cell receptive fields in the cat’s striate cortex. I. Journal of Neurophysiology, 69, 1091–1117.
doi:10.1152/jn.1993.69.4.1091 ↗Review ref. 8 · first-order motion prediction
McLean, J., Raab, S. & Palmer, L. A. (1994). Contribution of linear mechanisms to the specification of local motion by simple cells in areas 17 and 18 of the cat. Visual Neuroscience, 11, 271–294.
doi:10.1017/S0952523800001632 ↗Elongated ON/OFF subregions
Hubel, D. H. & Wiesel, T. N. (1959). Receptive fields of single neurones in the cat’s striate cortex. Journal of Physiology, 148, 574–591.
doi:10.1113/jphysiol.1959.sp006308 ↗RF size & cortical magnification
Hubel, D. H. & Wiesel, T. N. (1974). Uniformity of monkey striate cortex. Journal of Comparative Neurology, 158, 295–305.
doi:10.1002/cne.901580305 ↗Two-dimensional Gabor approximation
Jones, J. P. & Palmer, L. A. (1987). An evaluation of the two-dimensional Gabor filter model of simple receptive fields. Journal of Neurophysiology, 58, 1233–1258.
doi:10.1152/jn.1987.58.6.1233 ↗Gabor-shaped subunits · aspect ratio Y/X
Liu, L. et al. (2016). Spatial structure of neuronal receptive field in awake monkey secondary visual cortex (V2). PNAS, 113, 1913–1918.
doi:10.1073/pnas.1525505113 ↗RF diameter scaling with eccentricity
Freeman, J. & Simoncelli, E. P. (2011). Metamers of the ventral stream. Nature Neuroscience, 14, 1195–1201. Their physiological meta-analysis estimates V1 scaling at 0.21 ± 0.07.
doi:10.1038/nn.2889 ↗Macaque V1 cortical retinotopy
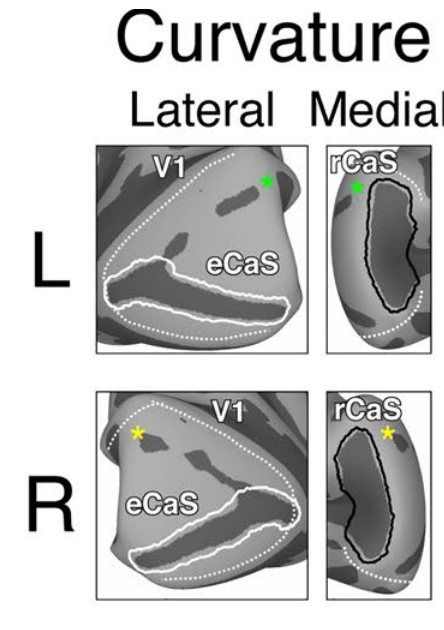
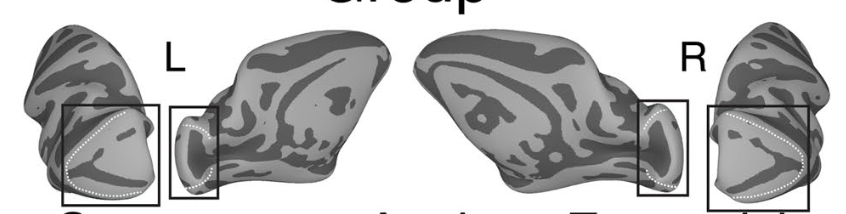
Arcaro, M. J., Livingstone, M. S., Kay, K. N. & Weiner, K. S. (2022). The retrocalcarine sulcus maps different retinotopic representations in macaques and humans. Brain Structure and Function, 227, 1227–1245.
doi:10.1007/s00429-021-02427-0 ↗Macaque V1 spatial-frequency selectivity · 16 c/° slider limit
De Valois, R. L., Albrecht, D. G. & Thorell, L. G. (1982). Spatial frequency selectivity of cells in macaque visual cortex. Vision Research, 22(5), 545–559.
doi:10.1016/0042-6989(82)90113-4 ↗Contrast-modulated 1/f Gaussian noise · Fourier-corrected STA
Niell, C. M. & Stryker, M. P. (2008). Highly selective receptive fields in mouse visual cortex. The Journal of Neuroscience, 28(30), 7520–7536.
Journal webpage ↗doi:10.1523/JNEUROSCI.0623-08.2008 ↗